bcXML visualiser
Reinout van Rees
http://www.tudelft.nl
$Id: visualiser.xml,v 1.11 2002/01/29 20:52:12 reinout Exp $
Table of Contents
The reference architecture of eConstruct [econstruct] (eConstruct document D201) has at it's core a taxonomy server (dealing with the definitions of objects and properties and their multi-lingual information) and a supplier catalogue server (storing catalogues and allowing searches in them). Those two are augmented by a visualisation module, displaying the information in them.
The idea is to keep every part of functionality isolated, thereby building several inter-operable parts that do only one thing, but do it very well. For instance, the catalogue server searches for information in it's catalogues and hands the resulting data to the visualiser module that only transforms the data to a human-readable format.
Time constraints have prevented the creation of this separate visualisation module for the moment, though. Instead a single stylesheet was made for easy replacement of the previous stylesheet that was included in the supplier catalogue server.
The html visualisation of bcXML data is basically only a mapping from the bcXML tag (like Door) to the word door, deur or porta, depending on the desired language. This information is contained in the taxonomy
While it is possible to write a program that contacts the taxonomyserver and downloads the desired information in order to display the correct translations, this turned out to be a lot of work (apart from the time it takes to complete the action). Therefore the decision was made to do all this work beforehand. Namely to generate an XSLT stylesheet (a file containing instructions on how to modify an XML document) which adds the information contained in the taxonomy to a given bcXML input file. So an incoming
<Door>
  <height m="2.40"/>
</Door>
would be transformed into
<Door>
  <html:span>door</html:span>
  <height m="2.40">
    <html:span>height = 2.40 m</html:span>
  </height>
</Door>
This results in one single XSLT stylesheet, capable of formatting any given bcXML document. And without contacting external taxonomyservers. It works stand-alone, which helps integration into other programs. This was demonstrated by the easy inclusion in the supplier catalogue server. In that program it turned out to be a plug-and-play replacement of a much simpler stylesheet made half a year earlier.
A simple stylesheet can be used to filter out all html information, adding a customised header and footer in the process, to create the html page. This allows the usage (in a row) of stylesheets that add even more (html-) information to the original bcxml-file. A first usage of this is that the catalogues in eConstruct also contain non-taxonomy properties. From these 'external' properties a small catalogue-specific taxonomy is constructed. Applying a visualisation stylesheet generated from the 'main' taxonomy and one generated from the 'external' taxonomy in a row, followed by the extraction of the html information should visualise every object and property in that catalogue.
To get above results as soon as possible, the 'main' visualisation stylesheet is generated from the 'main' taxonomy and the (currently 12) 'external' taxonomies at the same time, resulting in one stylesheet capable of visualising in full every bcXML file now in existence.
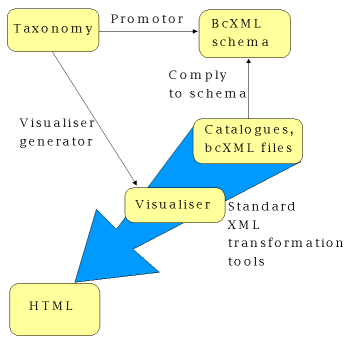
Figure 1. Overview of visualiser architecture
An extra feature enabling quick results was to make it the default behaviour of the stylesheet to replace the bcxml with html, instead of adding html. Setting one parameter allows to use the stylesheet in the 'adding' mode, described above. So, by default,
<Door>
  <height m="2.40"/>
</Door>
is now transformed into
<html:span>door</html:span>
<html:span>height = 2.40 m</html:span>
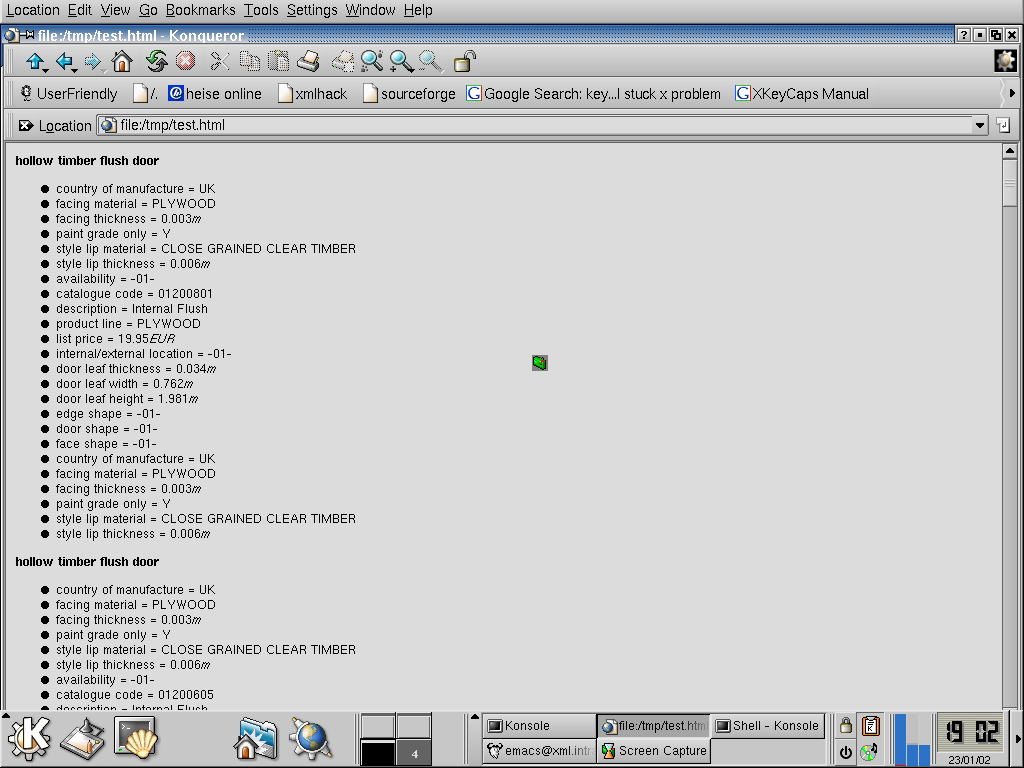
Figure 2. Example of visualised bcXML catalogue
The visualisation stylesheet can be downloaded from sourceforge.
The eConstruct project decided to publish some of the results as open source [opensource] software to better facilitate use and re-use of the project's results. This was also prompted by the increased attention in "Brussels" for open source software and it's advantages. The visualiser part of the reference architecture is one of the parts that's distributed as open source.
The source code can be obtained using CVS from sourceforge.
Using the principle described in [unittest], automated tests have been written to ensure the correct conversion. This makes it more feasible to adapt the software, as adaptions are automatically tested for correctness. The tests are available with the source code.
Bibliography
[econstruct] econstruct web-site. On-line at econstruct.org.
[isopas] ISO PAS 12006-3. On-line at icis.org .
[opensource] open source web-site. On-line at opensource.org.
[sourceforge] sourceforge download site. On-line at sourceforge.net.
[stabu] Stabu foundation web-site. On-line at stabu.nl.
[unittest] unit tests. On-line at extremeprogramming.org .